Location: Tools Menu
The Isotopic Distribution module allows you to predict the masses and abundances of the isotopes for a given formula. This information is useful for comparison to observed mass spectrometry data in helping to predict the number of atoms of a given element in the formula. The abundances are calculated by knowing the observed natural abundance of each element in the formula, and convoluting these natural abundances to predict the isotopic abundances. When you start the module by choosing Isotopic Distribution from the Tools menu, the currently selected formula is copied to the Isotopic Distribution form. You can also type or paste a new formula in the formula box. Whenever computing isotopic distributions the weight mode will be automatically changed to Isotopic weights; this cannot be changed.
As an example, the molecule C6H5Cl weighs 112.00797 Da. Its isotopic distribution is:
| Mass | Fraction | Intensity | Potential Combinations of Atoms | ||
| 112.00797 | 0.7098995 | 100.00 | 12C6 1H5 35Cl | ||
| 113.00797 | 0.0466010 | 6.56 | 12C5 13C 1H5 35Cl | 12C6 1H4 2H 35Cl | |
| 114.00797 | 0.2281708 | 32.14 | 12C4 13C2 1H5 | 12C6 1H3 2H2 35Cl | 12C6 1H5 37Cl |
| 115.00797 | 0.0149130 | 2.10 | ... | ||
| 116.00797 | 0.0004092 | 0.06 | ... | ||
| 117.00797 | 0.0000060 | 0.00 | ... | ||
This means that 70.98995% = 71% of the compound will contain six 12C atoms, five 1H atoms, and one 35Cl atom. However, it is also possible that one of the six carbon atoms could be Carbon-13, which would increase the weight of the compound by one Da. It is equally possible that one of the five Hydrogen atoms could be Hydrogen-2, also increasing the weight by 1 Da. The probability of either of these happening is 4.66%, as shown by the above table. I have also shown the three possible compounds that would result in a 114.00797 Da compound. The program does not list all of the possible combinations of atoms; I have added those to the above table to illustrate the concept.
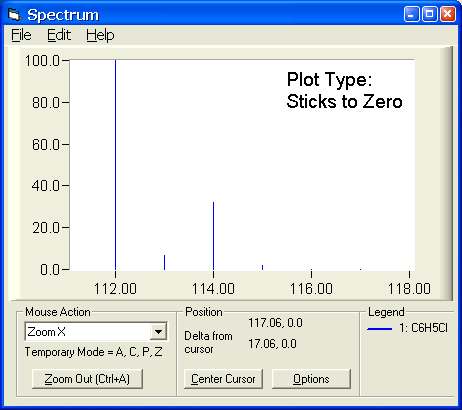
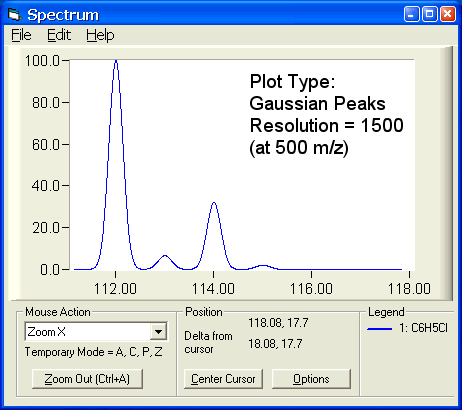
By checking the Plot Results box, the distribution will be plotted. The plot will update faster if you use Options | Plot Type | Sticks to Zero (left plot below). However, you can see the effect of the mass spectrometer's resolution on the ability to see the isotopes by changing the Plot Type to Gaussian Peaks in the Isotopic Distribution window. The plot will change depending on the effective resolution and corresponding m/z you have defined (see below for details). See the Plotting Help for more information on configuring the plot, zooming and out, and panning the plot view.
You can copy the results to the clipboard by clicking the Copy button or by selecting the results box, pressing Ctrl+A to select all, and Ctrl+C to copy. Since the values are separated by tabs, you can paste the data directly into Microsoft Excel and it will be properly placed into adjacent cells.
 |  |
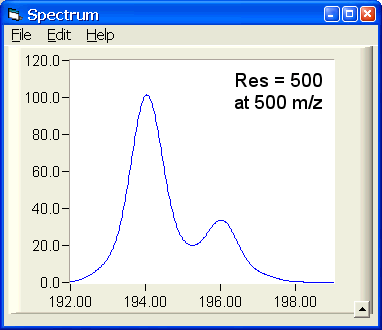
The width of the Gaussian peaks can be modified by specifying the effective resolution and effective resolution m/z. The higher the resolution, the sharper the Gaussian peak. Typically, Quadrupole instruments have resolutions between 500 and 5000. Time of Flight (including Q-Tof) instruments have resolutions of 5000 to 30,000. Fourier Transform ICR (FT-ICR) instruments have resolutions ranging from 50,000 to 1,000,000.
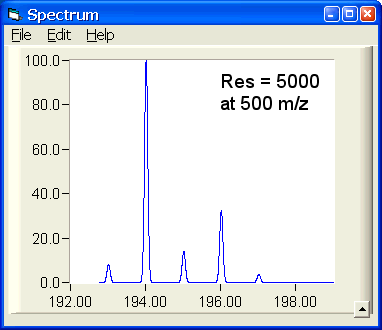
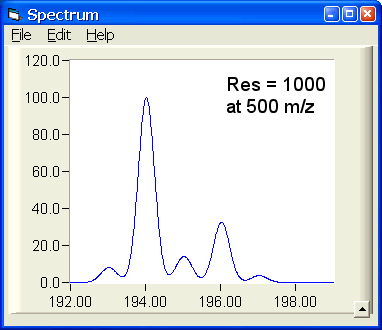
Resolution in mass spectrometry is technically only valid at a single given mass, since it is computed by dividing the mass by the smallest spacing between two masses that can be discerned (m ÷ ΔM). For this reason, you must also specify an m/z at which the resolution applies. At lower resolutions, the Gaussian representation of adjacent peaks may begin to blend together, a phenomenon commonly seen on lower resolution instruments. The following four pictures illustrate the plot produced for the same four masses at four different resolutions.
|
|

|
|
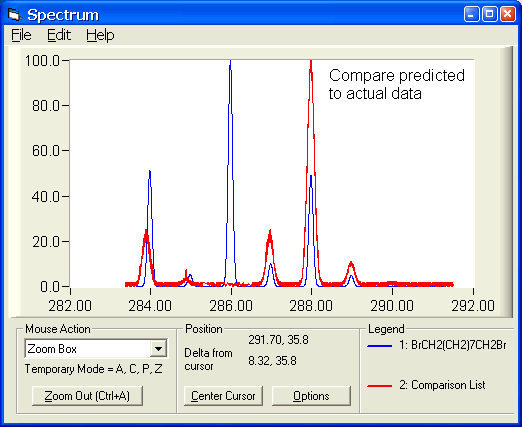
You can compare the predicted isotopic distribution to another spectrum by copying the spectrum to the clipboard, then clicking the Paste List of Ions to Plot button. The format of the ion list should be a list of mass (m/z) and intensity pairs, separated by a space, tab, or comma, with each mass/intensity pair on a separate line. If the data consists of discrete masses (centered data), then set the Plot Type to Sticks to Zero or Gaussian Peaks. In the case of Gaussian peaks, each of the masses will be converted to a gaussian peak, using the specified options. If the data consists of high resolution, raw data (continuum data), then set the Plot Type to Lines Between Points. If more than 1000 masses are pasted, and the Plot Type is changed to Gaussian Peaks, a warning message will be shown the first time the Gaussian Peaks mode is selected. This is done to prevent you from accidentally choosing the Gaussian Peaks mode with continuum data. The pasted list can optionally be normalized to 100. Additionally, the plot color for the comparison list can be customized.
 |
In addition to entering a formula on the Isotopic Distribution window, you can place your cursor on a formula line in the main Molecular Weight Calculator window and choose Tools | Show Isotopic Distribution for Current Formula (or press Ctrl+D). This will compute the distribution and plot it, but not show the Isotopic Distribution window. Finally, while using the Formula Finder, you can view the isotopic distribution of any of the formulas in the results list by placing your cursor on the results line and choosing the Display Iso Abundance button (or by pressing Ctrl+D).
It is allowable to have explicitly defined Isotopes present in a formula (for example ^13C6). Since an explicitly defined isotope has just one mass, it has no "distribution". Thus, the result is to simply increase the observed weight of the formula by the mass of the isotope. For example, C6H6 weighs 78.04695 Da and has 4 possible isotopes. Adding one Carbon-13 to give C6H6^13C simply shifts the mass up by 13 to 91.04695, still giving 4 possible isotopes. However, ^13C6H6, with all Carbon-13 atoms weighs 84.04695 (6 Da more than 78.04695) and only has 2 isotopes, those contributed by Hydrogen-1 and Hydrogen-2.
Due to the above behavior for explicitly defined isotopes, the abbreviation D, for deuterium, must be replaced with its explicitly defined equivalent, ^2.014H prior to computation. This will be done automatically for you if you enter a formula containing deuterium.
Two papers useful for learning about the computation of isotopic abundance distributions are:
IsoPro 3.0, written by Mike Senko, can also be used to compute isotopic distributions and abundances. The software is faster than my implementation and can handle larger compounds (more atoms, more combined elements) than mine can. Finally, it also shows very detailed molecular weights of each isotope. If you need more precise isotopic distribution computations than provided with my software, I suggest downloading IsoPro and trying it out. Download from http://members.aol.com/msmssoft
I will point out, in my defense, that my software is easier to use, the plotting window is easier to zoom in and out of, and the Molecular Weight Calculator is freeware. Further, from the testing that I have performed, the abundances and masses computed with my software vs. IsoPro are very similar.
Back to the Molecular Weight Calculator download page